
Shasta Land Trust Impact Map
Updated: Sep 16
Turning Conservation Accomplishments into a Map the Community Can Understand
Overview
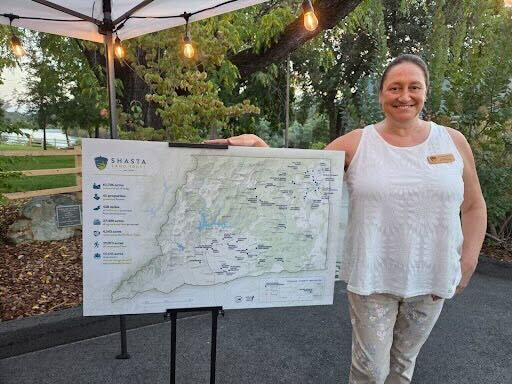
Shasta Land Trust wanted to communicate the scale of its conservation work across Northern California in a format that could make an immediate impression at its annual event and remain useful afterward. Green Goat Maps transformed property locations and organizational impact statistics into a 3 × 2-foot display map and web-ready communication asset.

Scope of Work
To meet the needs of Shasta Land Trust, Green Goat Maps was contracted to create a clear regional map of conserved properties, resolve dense clusters of labeled sites, develop an inset for Tehama County, integrate organizational branding, feature key conservation statistics, and prepare versions suitable for both large-format printing and digital communication.
Key Deliverables
The finished design maps 41 conserved properties while highlighting the broader impact of the Land Trust's work, including more than 61,706 acres protected, 428 miles of waterways safeguarded, 27,400 acres of agricultural land maintained, 15,141 acres dedicated to climate research, and 4,343 acres returned to the Pit River Tribe.
Challenges & Solutions
Displaying every property while maintaining a readable regional map required careful label placement and cartographic hierarchy, particularly where conserved properties were clustered. The impact statistics also needed to command attention without competing with the map itself. Green Goat Maps used an inset, controlled typography, and a clear division between geographic and statistical information to solve both problems.
Results & Client Value
The resulting map gives Shasta Land Trust a visual summary of its conservation footprint that supporters, partners, and community members can understand quickly. It works both as an event centerpiece and as an ongoing communications tool.
Looking for a Similar Solution?
Have years of conservation accomplishments that are difficult to communicate in a spreadsheet or annual report? Green Goat Maps can turn your organization's impact into a map people can see and understand.


Comments